Score every submission on the risk data your combined ratio depends on.
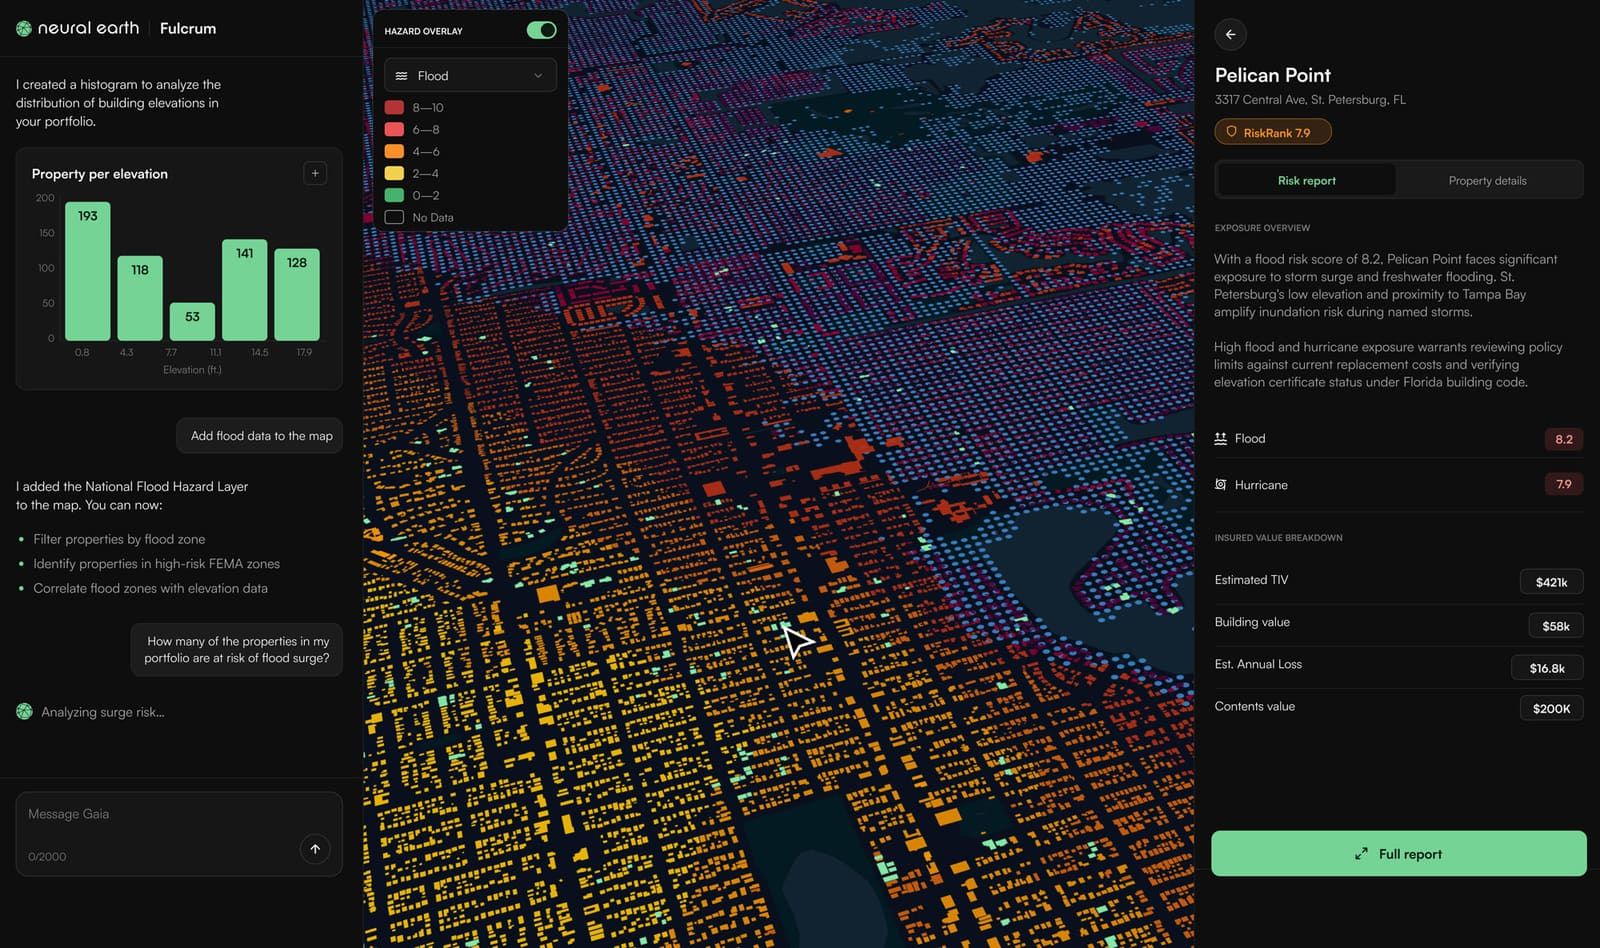
Underwriters work with fragmented signals from multiple vendors and make defensible decisions at speed. Fulcrum connects every signal — climate, structural, hazard, and portfolio context — into a complete risk picture at the submission level, continuously updated, and built to stand up under regulatory and reinsurance scrutiny.
Fragmented data misprices P&C risk. Here's what changes when every signal connects.
One RiskRank score per submission, built for the perils in your book.
Most risk models are additive: they score each hazard independently and sum the results. RiskRank, Neural Earth's proprietary risk scoring framework, models how risks interact and amplify each other — so the score reflects compound exposure that isolated inputs miss. Every factor is traceable to source, every score is explainable, and the methodology holds up under reinsurance review and DOI scrutiny.
One methodology. Every underwriter. Every submission.
Catastrophe Modeling That Informs the Bind Decision, Not the Post-Mortem.
Fulcrum replaces backward-looking averages with forward-looking cat scenarios across wildfire, flood, wind, and severe convective storm perils. Stress test your in-force book against climate projections and live hazard data — so your cat team sees evolving exposure before it moves your combined ratio, not after.
The cat model that runs after the bind decision is a report. Fulcrum runs before it.
Identify the submissions worth writing before your competitors price them wrong.
Fulcrum surfaces properties that match your underwriting appetite across the full market universe — including defensible risks that retreating competitors are declining based on incomplete data. Define your criteria once. Fulcrum identifies the opportunities continuously, ranked by fit against your book.
The best submissions in a hard market go to the carrier with better data.
From fragmented signals to a complete risk picture on every submission.
Today
Fulcrum — Catastrophe Modeling
Risk scores sourced from disconnected vendors with no shared methodology or audit trail.
One composite RiskRank score per property, every factor traced to source, version, and date. Auditable on demand.
Concentration analysis runs post-bind in separate GIS tools, once per renewal cycle.
Concentration and aggregation monitored continuously. Drift visible the same day it occurs.
Hazard models rely on historical averages that no longer reflect how perils are actually moving.
Forward-looking scenario modeling across wildfire, flood, wind, and atmospheric perils. Updated continuously.
Sourcing new opportunities requires manual data pulls across multiple vendors before a single property is evaluated.
Criteria defined once. Every matching property surfaced continuously across the full market universe.
Underwriting, portfolio review, and risk reporting run in separate systems with no shared data layer.
One surface connects scoring, concentration, hazard modeling, and opportunity discovery. Same data, every team.
Price on the full risk picture, not a fragmented view.