
Prometheus Physical risk intelligence for insurance and reinsurance
Solutions / Disaster Management & Resilience

An always-on intelligence layer for disaster planning, response and recovery.

Every structure. Every occupant. Every lifeline. One picture before, during, and after the event. Prometheus holds a live parcel-level record of the built environment. A watch goes up, Prometheus runs the footprint: what is exposed and what will fail. Plan and prepare for all scenarios before they actually happen.

See the response workflow
Who uses it
  • FEMA regions & HQ
  • State & local emergency management
  • Mitigation & grants (HMGP · BRIC)
  • Recovery (IA · PA)
  • Lifeline owners & utilities
  • Planners & GIS
PrometheusDecision workspace / Illustrative dataset
Scenario / Coastal metro · Category 4 · 45,450 H3 cellsAdvisory → Footprint → Structures & occupants → Lifelines → Brief
Decision brief / T−72h

Who is in the footprint. What breaks. Where the trucks can still go.

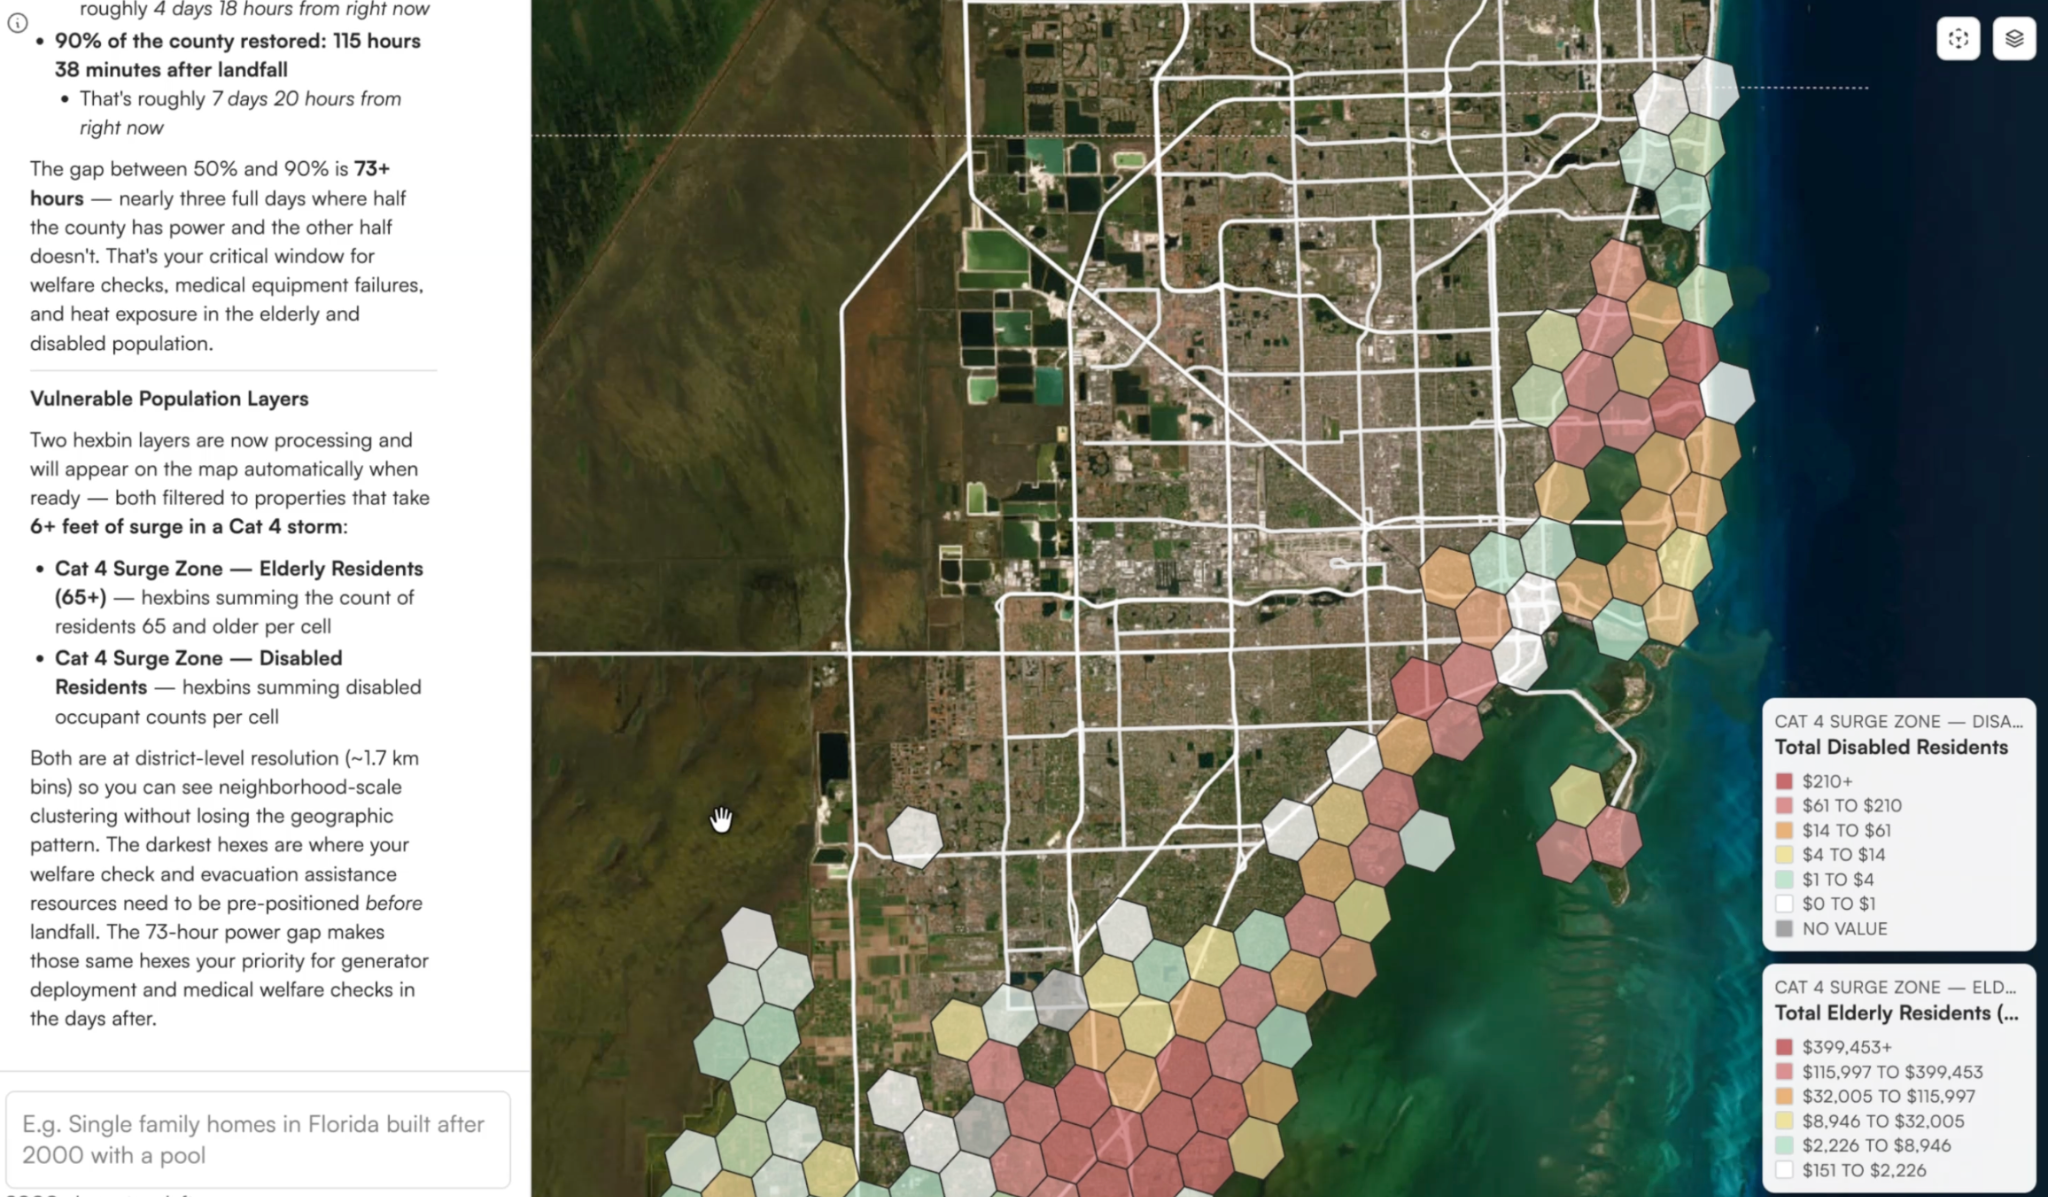
Surge and wind footprint over every structure and estimated occupant, rolled up to H3 cells, tracts and counties. Lifelines and shelters tested against modelled depth.

Prometheus coastal disaster resilience map showing storm-surge exposure, vulnerable population layers, and recovery planning analysis.
H3 r10 · surge depth · occupants_est · lifelinesRe-run on every advisory
Advisory → Footprint → Structures → Rule → Decision-makerDecision authority retained
Illustrative product interface. Not a representation of released functionality.All values shown are examples, not customer results.
Before, during, after

Four questions an EOC asks. Answered from one record.

Hazard maps show where. Facility lists live in separate systems. Damage arrives days later on paper. Prometheus keeps structures, people, hazards and lifelines in one record and answers from it at every phase.

Planning

Where are the people and structures most at risk, and what would reduce it?

Every structure in the jurisdiction scored for flood depth, surge, wind, wildfire and seismic risk, with estimated occupants. Rank mitigation projects by structures and people protected per dollar. Evidence formatted for hazard mitigation plans and grant applications.

Response

Who is in the footprint right now, and what will break?

Footprints run on every advisory. Structures, occupants, shelters, hospitals, power, water and road segments tested against modelled depth and wind. A ranked list of priority cells for evacuation, sheltering and pre-positioning, hours before landfall.

Damage assessment

How bad is it, where, before the teams can get in?

Post-event imagery tasked on the worst cells at landfall + 24h. Roof and structure damage counted per parcel. Preliminary damage counts by tract and county ahead of windshield surveys.

Recovery

Which households and facilities need help first, and are they getting it?

Damaged structures ranked by severity and occupants. Repair and rebuild tracked from permits and imagery. Substantial-damage candidates flagged. Progress reported by tract, month over month.

01What it does

One record of the built environment. Nationwide.

Built and audited in the most demanding commercial use of property data. Pointed at emergency management without a new stack.

01.1 / Structures

Resolve
every structure in the jurisdiction.

3,000+ counties of parcel coverage. Every building footprint keyed to its parcel. Occupancy and use classified. Estimated occupants per structure from structure count, occupancy class and census density.

Diablo · Derecho
01.2 / Hazards

Score
every structure for every hazard.

Flood depth and frequency, storm surge, hurricane wind, hail, wildfire with defensible space, earthquake. Structure-level, not zone-level. Grounded in HAZUS and National Risk Index data you already use.

Vigil · Pyre · RiskRank
01.3 / Events

Run
the footprint on every advisory.

Live hazard feeds stream in through Jetstream. Deterministic footprints run at T−72h, T−48h and T−24h and re-run as the track shifts. Structures, occupants and lifelines intersected. Results pushed to the EOC.

Jetstream · Vigil
01.4 / Damage

Count
the damage from the air.

Post-event imagery tasked on priority cells. Roof and structure damage assessed per parcel. Where satellites cannot fly, Neural Aerospace's KittyHawk platform tasks the imagery: sensor-agnostic, GPS-denied navigation, 50 kg / 50 min / 50 km class.

Earth Observatory · Neural Aerospace
01.5 / Lifelines

Test
the lifelines.

Hospitals, shelters, power, water, communications and road segments tested against modelled depth and wind. Nearest passable route computed for every critical facility. Rolled up by community lifeline.

Con-Q
01.6 / Brief

Ask
in plain language.

GAIA turns the fifteen questions in a decision brief into queries over the record and drafts the brief with every number traced to its source. Analysts stay in charge. The brief ships in hours.

GAIA
Your data & feedsNHC advisories · lifeline inventories · shelter lists · GIS
PrometheusOne live record of structures, people and hazards
Your decisionsPlan · Evacuate · Pre-position · Assess · Recover
02How it fits the operation

Plan, respond, assess, recover.

Runs inside the planning cycle, the EOC and the recovery office you already operate.

Fifteen questions, before the first advisory expires.

Define the area and the scenario. The footprint runs over every structure and occupant estimate. Lifelines and shelters are tested. GAIA drafts the brief with sources. Re-runs on the next advisory and shows what changed.

Ask the map a question
Brief / Coastal metro · Cat 4Human review
  1. 01Run footprint on the advisory45,450 cells
  2. 02Roll up structures, occupants, lifelinesBy tract · county
  3. 03Draft brief with sources15 questions
Next stepBrief → EOC

Illustrative workflow; final authority remains with your organisation.

03Ask the map

Questions the EOC asks.

Ask in plain language. Every answer shows its sources.

Ask GAIA / Examples
GAIA / Answer

218 cells. 412,000 estimated occupants. 61 shelters outside the footprint.

Occupants from structure count, occupancy class and tract density. Shelters from your list. Distance by road. Ranked list exported for evacuation planning.

MDLHow it was produced → Surge footprint · occupants_est · shelter list · routing
Asking is free · Analysis is metered · Provenance on every valueIllustrative answers

GAIA is advisory. Decisions and authority remain with you.

04Current tools vs. Prometheus

A hazard map shows where. Prometheus shows who, how many and what breaks.

Zone maps, facility lists and damage surveys each answer one question, in a different system, on a different timeline. One record answers all of them at every phase.

DimensionCurrent toolsWith Prometheus
ResolutionZones, tracts and county-level estimates.Every structure and its estimated occupants, rolled up to any boundary.
TimingExposure estimated after landfall.Footprint run on every advisory from T−72h. Re-run as the track shifts.
DamageWindshield surveys over days.Imagery tasked at T+24h. Damage per parcel. Counts by tract before teams deploy.
LifelinesFacility lists maintained separately.Facilities and road segments tested against modelled depth. Nearest passable route computed.
MitigationProjects justified one at a time.Every project modelled against the same record. Ranked by people and structures protected per dollar.
TransparencyModels with methods locked away.Source, date, method version and confidence on every number. Same inputs, same output.
05Evidence

Production scale. Audited methods.

The platform runs today for organisations that are audited on every number. Where a figure is an internal benchmark, it says so.

45,450

H3 cells in one Category 4 decision-brief scenario over a coastal metro.

Structures to occupants to tract rollups. Fifteen brief questions answered from the record.

3,000+

counties of parcel coverage. 99% of the U.S. population. Refreshed quarterly.

Accuracy reported to the NSSDA standard with a confidence tier per record.

403,352

properties resolved in 36 minutes in a portfolio audit.

June 2026. All but 29 resolved. Internal benchmark against the incumbent geocoder, not independent validation.

6.8M

California structures scored by a 12-factor wildfire model.

Structure-level, with each factor's source and weight shown.

Deployment in a dedicated or government cloud environment by SOW. No accreditation claims are made on this page; scope is defined with the contracting agency or prime.

05Evidence & control

Every number shows its source.

Source, method, rule, decision-maker. Nothing on the platform produces a number it cannot explain.

01

Source.

Each value shows which source produced it, when it was observed, and where data is missing.

02

Method.

Observed, inferred and modelled values are labelled. Occupant estimates carry their method version and confidence.

03

Rules.

Thresholds and priority rules are yours. Prometheus ranks; the incident commander decides. No automated tasking without your rule.

04

Deployment.

Dedicated or government-cloud deployment by SOW. API, batch and streaming. Data stays under your control.

Open the example record. Then bring your own scenario.

06How it's priced

Simple at the contract. Sophisticated underneath.

Government engagements are priced by task order or SOW. One credit meters consumption underneath, so cost is transparent to the programme office.

One credit

One credit prices every action.

Transparent to the programme office. No platform fee, no module fees, no seat pricing.

Alerts are free

Monitoring, alerts and reads are not metered.

You pay for footprints you run and structures that changed, not for watching.

Task order or SOW

Priced for the programme, not per user.

Dedicated environment, data handling and support defined with the agency or prime.

Start with a brief

A decision-brief demonstration on an area you choose.

Your scenario, your lifeline list, the real platform.

Time to value
Days
A decision brief on your area of interest.
Weeks
Advisory feeds and lifeline lists connected.
Quarters
Jurisdiction-wide record, integrated with the EOC.

Ask for the rate card and a target-account scenario built on your own volumes.

Neural Earth / Prometheus

Bring the area of interest. We'll run the brief.

Pick a jurisdiction and a scenario. We run the fifteen questions over the live record and show every source.

Decision evidence

An illustrative record for the pre-bind exposure check. This is a proposed interface, not a live model output.

EVD · EXAMPLE-P0418Review
Decision record
EXAMPLE-P0418 / Referral required
Input basis
Synthetic location TIV: $18.0M. Synthetic current-area gross TIV: $185.0M.
Geographic scope
5-mile radius around the proposed location. The map screenshot is shown separately; no spatial computation was performed for this example.
Method
Illustrative deterministic arithmetic: 185 + 18 = 203; 203 / 250 = 81.2%; 250 − 203 = 47. Values in USD millions.
Configured rule
Review at utilization ≥ 80%. Breach above 100%. Example cap: $250M. Not a reinsurance treaty provision.
Source status
Illustrative values, not verified source data. No measured model-confidence score is asserted.
Decision authority
Designated exposure reviewer. No automated quote, bind, or external-system write.
Production requirements
Source IDs, observation times, method versions, spatial methodology, deduplication rules, and authorized reviewer records.
Illustrative dataHuman approval retained

Start with the decision ahead

Tell us which decision your team is working through. We will use that workflow to shape the conversation. This form prepares an email in your mail app; it does not submit or store your information.

We will use the workflow you select to shape the conversation and follow up by email.